
Page 122 - MONO_AR_2016_EN
P. 122
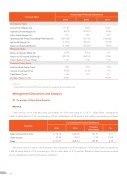
Financial Ratio
Consolidated Financial Statements
2016
2015
2014
Profitability Ratio
Gross Profit Margin (%)
Operating Profit Margin (%)
Other Profit Margin (%)
Operating Cash Flows to Operating Profit Ratio (%) Net Profit Margin (%)
Return on Equity (ROE) (%)
Return on Assets (ROA) (%) Return on Fix Assets (ROFA) (%) Total Assets Turnover (Time)
Debt to Equity Ratio (Time) Interest Coverage (Time) Cash Basic (Time) Dividend Payout 1/ (%)
Remark
20.18 (6.21)
1.70 (580.98) (11.81) (10.42)
(1.78) (22.74)
0.40
1.28 (0.65) 0.49
38.66
12.69 (23.21)
1.67 (53.09) (25.27) (18.24)
(7.63) (68.19)
0.36
1.18 (3.06) 0.73
-
33.77 (4.76)
4.81 (198.86) (0.77) (0.41)
0.10 11.94 0.36
0.85 0.05 0.10
46.68
Efficiency Ratio
Financial Policy Ratio
1/ Calculated from the Net Pro t according to the separate  nance statements.
Management Discussion and Analysis 1) Overview of Operation Results
Revenue
Total revenue of the Company and subsidiaries for 2016 amounted to 2,112.70 million Baht, compared to 1,925.14 million Baht in 2015, increasing by 187.56 million Baht or 9.74 percent, with details summarized as follows:
Revenue
Consolidated Financial Statements
2016
2015
Increase (Decrease)
%
Sales and service income Other income
Total
2,076.76 35.94 2,112.70
1,892.96 32.18 1,925.14
183.80 9.71 3.76 11.68 187.56 9.74
Sales and service income of the Company and subsidiaries for 2016 totaled 2,076.76 million Baht, compared to 1,892.96 million Baht in 2015, increasing by 183.80 million Baht, or 9.71 percent. Details of sales and service income can be categorized in terms of business as follows:
122
